
…it’s about financial IED’s (Improvised Explosive Devices) with “Chinese Characteristics” embedded in America’s financial markets.
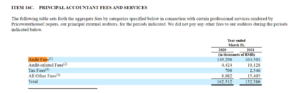
As you know, the primary value proposition I try to bring to my readers is:
I scour the planet for financial reports and government documents that nobody reads or cares about. I read them, interpret them and explain exactly how these documents and the underlying transactions/trends will eventually change your life forever. Hey, it’s what I do. I consider it a public service. You can thank me later…
So let’s start today’s discussion with a general review and primer on “how to read Chinese SEC filings”… then we’ll apply what we’ve learned to both the last Tesla 10-K and the current Alibaba 6-K , 20-F (and prior filings) and we’ll see what conclusions we can draw. After that, we’ll move on and dig into the Cayman Islands Monetary Authority (CIMA) Fact Sheets and Investments Statistical Digest and finish up with a review of the Financial Stability Board’s (FSB) annual Global Monitoring Report on Non-Bank Financial Intermediation as it applies and compares to the Observatory of Economic Complexity (OEC) visualization data. What fun! Are you ready!
Let’s do it!
As always, out of respect for your time, here are the key takeaways, in The RED Executive Summary immediately below. Other unusually pithy pearls of wisdom will also be highlighted in RED farther below as well….
1.) TESLA: The most current Tesla 10-K is remarkably devoid of any meaningful/material disclosure regarding Chinese operations. A review of these limited disclosures would suggest that if it was not for Chinese financing and support, Tesla would be woefully unprofitable and likely insolvent. We can make some guesses and compare some basic ratios which illustrate the odd operating metrics which can likely only be accomplished through the use of Chinese Communist, deeply discounted, “off the books” funding. There is no other plausible explanation. This conclusion provides at least some level of clarity for Mr. Musk’s hubris laden “funding secured” proclamation we all enjoyed a while back.
2.) TESLA: The filings disclose that Tesla has 377 separate consolidated subsidiaries. 207 of which are related to the solar business. 52 of the non-solar subsidiaries are located in the United States. 45 of them are in China and 39 of them are in Europe. The remaining 34 seem to be scattered randomly across the planet. Oddly enough, there are 3 subsidiaries in the Cayman Islands…the same number of subsidiaries that are located in Japan (1) and the Middle East (2) combined. It would seem to me that the Japan and Middle East Oil Money Markets would be much more substantial, and have a much greater demand potential for Tesla products than the 60,000 struggling inhabitants of the Cayman Islands. But that’s just me. There is, of course, no mention of what the purpose of the 207 separate Solar subsidiaries might be used for or why they exist.
3.) ALIBABA: The company stopped publishing MAUs (Mobile Active Users), one of their long-time key eCommerce metrics in the current 6-K. This omission is likely because, at the prior quarterly growth rates, the number of MAUs would have exceeded the number of smart/cell phones in China. Probably best to leave it out. However, they did continue to publish AACs (Annual Active Consumers). This figure has now surpassed the number of adults in China and the United States combined. Sounds reasonable.
4.) ALIBABA: BABA’s “Gains on Deemed Disposals” (Asset Write-ups) amounts to $44 Billion, or roughly half of the company’s Net Income since the IPO in 2014.
5.) ALIBABA: BABA’s GMV as reported, amounts to roughly 25% of China’s Gross Domestic Consumption now. We discuss why this is likely absurd.
6.) Alibaba accumulated $7 Billion of “Questionable Assets” in the 15 years prior to the 2014 IPO. In the next seven years, following the IPO, after hooking up with GSIB Investment Bank Underwriters, they’ve accumulated an additional $161.8 Billion, bringing the total to $168.8 Billion in “Questionable Asset” value. To help you visualize this amount, it’s the equivalent of an additional 108 Burj Khalifas in questionable asset value accumulated during the last seven years. Think about a sprawling metropolis…roughly 5 square miles of city blocks, the entire skyline comprised of half-mile tall buildings, where every building is a Burj Khalifa, all erected in the last seven years. That’s what the current valuation of Alibaba’s “Questionable Assets” would look like if it was a construction project. It’s a strange visualization for a supposedly “asset light” business model.
7.) We discuss some of the accounting techniques that Alibaba might have deployed to capitalize these values that likely should have been expensed. We propose/infer that the Pricewaterhouse Coopers (PwC) HK office might possibly be the most inept, lazy, underpaid, or corrupt (hard to tell which) public accounting office on the planet.
8.) We discuss the 253 Chinese Stocks/ADRs/ADSs with a current market cap of $1.348 Trillion, currently listed on US Exchanges. (Again, nearly all sponsored by US “Big Bank” underwriters) Every one of these businesses likely has at least some level of material accounting issues and/or misrepresentation in the financial statements. I simply don’t have time to go through them all. Life is too short.
9.) We discuss the various types of businesses/entities that comprise the Chinese Communist Party’s “sources and uses” of Forex. These are generally Western businesses and “helpers” whose interests are subtly (or not so subtly) aligned with those of the the Chinese Communist Party…and by default directly aligned against the interests of Main Street America (i.e. you & me).
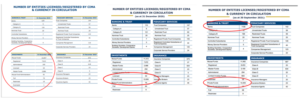
10.) We examine the FSB Global Shadow Bank Monitoring data and the meteoric growth of Financial Assets, particularly “OFI” (Other Financial Intermediaries) as defined by the Financial Stability Board (FSB) i.e.)Private Funds and Hedge Funds. OFI Assets in the 5 primary Tax Haven jurisdictions are projected to be $72.4 Trillion now, compared to $52.5 Trillion of OFI value domiciled in the US. For emphasis, Major jurisdiction Offshore Tax Haven OFI Assets are now $20 Trillion MORE than US Domestic/Onshore OFI Assets. Presumably much/most of this anonymous money is controlled by the Chinese Communist Party. There is no other logical, rational, reasonable explanation for this meteoric growth.
11.) We examine the CIMA (Cayman Islands Monetary Authority) “Fact Sheets” and raise concerns about the 983 new Banks and 14,385 new Private Funds (OFI’s) registered since 1/1/20. We are also concerned about the understaffed, rubber-stamp, CIMA “Angels of Death” and their lack of ability to regulate these diverse, global, ShellCo businesses, as well as the $15.9 Trillion they currently control.
12.) We revisit projections I had made several years ago based on the Observatory of Economic Complexity (OEC) data. The calculations describe what the stealth, anonymous CCP Investment portfolio valuation might look like, had the CCP been viewed as one “Elephant in the Room” investor, investing their entire trade surplus in a coordinated manner, achieving the same return as the S&P 500 over the last 25 years. In 2015 the portfolio valuation was $16.39 Trillion. Today it’s $52.06 Trillion. In other words, the Chinese Communist Party, through its surrogates, ShellCos and “helpers” now anonymously controls $52.06 Trillion of Western Financial Assets.
13.)The CCP believes, and based on the West’s posturing, rightly so, that the most expeditious, least costly way to win a war is if your adversary doesn’t understand that they are actually in one. The “end game” certain to follow the establishment of these total war beach-heads described above and the stealth financial skirmishes taking place in every nook and cranny of the planet, is the greatest, coordinated, fraudulent, illicit wealth transfer in history, inevitably culminating in the eventual destruction of Western Financial Markets and the death knell of the Dollar as the worlds Reserve Currency.
Please read on for a disturbing discussion of the gory details….
Let’s begin…..
For those of you who aren’t avid SEC.gov fans and are unfamiliar with the function/role of this venerable organization and, consequently, what we’re going to discuss today, I’ll try to give you a quick bullet-point intro:
1.) The SEC (Securities Exchange Commission) used to do what was referred to as “enforcement” related to “filings”. Listed companies were required to make these “filings” on a periodic basis. The purpose of these “filings” was initially to let investors know, based on an even/level playing field, how the business was doing, so they could make intelligent, informed judgments regarding the prospects of the business.
2.) Unfortunately, the process, over the years, has somehow morphed into a quarterly stock/security pump, dog and pony, rah-rah, show…. (Note that the SEC “filing” function has, for the most part, been replaced by Twitter/Reddit, etc. and COE’s saying just about anything “off the record” directly to their fan-boys and minions, accurate or not, with no adverse repercussion.) So here we are. Say hallelujah!
3.) Of course, it used to be “illegal” to make false, incomplete, misleading or inaccurate statements (intentional or not) in these required “filings” and furthermore, in a prior life, the SEC would take swift, sweeping and severe action as a comeuppance for anything resembling these types of transgressions. But, since nobody actually reads these things (including the regulators at the SEC and the Justice Department) or cares anymore, there is what has become a burgeoning cottage industry in the legal and accounting professions which helps management identify opportunities relating to exactly what they (management and their bankers and advisors) can “get away with” disclosing (and not disclosing) based on weighing the ever declining probability of “getting caught” and the even more remote possibility of getting “punished” against actually “saying what’s been said, writing what they’ve written and/or doing the deed that’s been done”.
4.) Of course, Chinese businesses have had enormous success, along with US Legal Counsel, their bankers and Public Accounting firms, in navigating this maze to their advantage. There is no truth/fact anymore…just opinion. The key concept/thing to remember when reading these filings is “what’s in them” is not necessarily as important as “what’s not in them” and whether what’s in them (and what’s not in them) is actually verifiable, reasonable and/or makes any sense at all.
5.) What?…you say! The Dickens!… you say! You are confused that I, DT, am actually implying that your beloved Tesla, the greatest electric-vehicle-solar-technology juggernaut on the planet, along with Alibaba, China’s eCommerce future and 252 other Chinese stocks and ADRs listed on America’s Stock Exchanges are all fakes? This can’t be!….they were all endorsed by America’s best and brightest, highly compensated, Investment Bankers, Accountants and lawyers! After all of this you are telling me that these securities are all Chinese controlled ticking time bombs stealthily planted to destroy Western Financial Markets? That can’t be! Impossible! Crazy talk!..
…..yes, perhaps I’m wrong. Perhaps America’s best and brightest, legions of highly compensated, Investment Bankers, Accountants and Lawyers are all correct. These stocks are a gold mine and the financial statements make perfect sense. These hard working standard bearers for integrity, in reality, are vigilantly on the lookout for threats to our democracy….they have no agenda, care nothing about money and are altruistically working for the good of the people. They aspire to a higher calling…..yes, that could be the case….
….but, for a moment, I’d ask you to forget everything you think you know about Tesla, Alibaba and Chinese Stocks/ADRs….and please focus, humor me… and read on….
The Tesla 10-K
The first thing we’re going to look at today is the 2020 10-K (filed February 8th 2021; 126 pages with several hundred pages of exhibits). For those of you who are new to this, “10-Ks” used to be “annual financial statements with a few footnotes”. Easy-peasy. How they’ve somehow morphed into massive, confusing nearly unintelligible tomes is baffling to me. Note that the word “China” is listed a total of 48 times in this filing (19 times in the Exhibit titles 10.68 to 10.73) :
https://www.sec.gov/ix?doc=/Archives/edgar/data/1318605/000156459021004599/tsla-10k_20201231.htm
…as well as the revised 2020 10-K/A, as amended (properly filed on 4/30/2021; 65 pages, again with several hundred pages of exhibits). Note further that the word “China” is not listed at all in the amended filing. (The word “China” remains listed 19 times in the same Exhibit titles 10.68 to 10.73; relisted without change) :
https://www.sec.gov/Archives/edgar/data/1318605/000156459021022604/tsla-10ka_20201231.htm
The relevant “China” discussion takes place within a few paragraphs on four (4) pages in the initial 2/8/21 filing).
Pg 27 – The Shanghai Gigafactory is “owned” with 50 year land use rights. Value/cost/basis is, of course, not disclosed/described.
Page 81 – Total “China debt” is $616 million, all longer term with $1.372 Billion remaining available under the line of credit with China Merchant’s Bank, maturing June 2021 thru December 2024.
Page 86 – Summary of the China loan agreements.
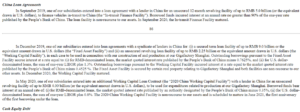
Page 99 – Operating Lease Arrangement on the “Gigafactory” in Shanghai, China
Generally, if Tesla doesn’t hit certain milestones re: annual tax revenue (RMB2.23 Billion per year) and qualified capital expenditures (RMB14.08 Billion) or, US$340 Million and US$2.2 Billion respectively (at the current exchange rate), the Chinese government can/will seize the factory in 2024 if Tesla fails to make these milestones. The Chinese Government will, of course, being the good Samaritans that they are, apparently agree to reimburse Tesla fairly for their involvement in the whole misguided adventure. Current progress toward these milestones is, of course, not discussed.
The general parameters of the above referenced Land Use & Loan Agreements are described in Exhibits 10.67 to 10.73.
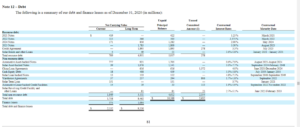
Finally, on page 105, Note 21 – Segment Reporting and Information about Geographic Areas:
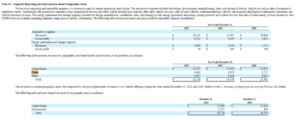
We have a “not so detailed” description of China operations and the inherent yet nebulous contribution to the raging success which Tesla has somehow become known for. Unfortunately, since the Tesla, and in fact all Chinese financial statements, are always magically voluminous yet somehow simultaneously barren deserts of usable information, and Tesla management refuses to disclose anything meaningful, like an up front, honest management team might choose to do. i.e.) they’ve chosen to be opaque and secretive about what’s really happening with the China operations. Therefore, we are forced as analysts, to make some educated guesses about what’s really going on here. What the above, sparse table tells us is that:
- China revenue from all segments (presumably all Automotive) is $6.662 Billion or 21% of total Revenue of $31.536 Billion. The US is at 48% and the Rest of the World is at 31%.
- Long Lived Assets (Property, Plant, Equipment, Goodwill, ect. presumably anything that’s depreciated or amortizable are $18.716 Billion.) of that total, 85% or $15.989 Billion are domiciled in the United States. 15% or $2.737 Billion are domiciled “somewhere else”. Again, since we have to guess the level of these Assets in China, since there are 6 factories, 4 in the United States (Fremont, CA; Buffalo, NY; Austin, TX; Sparks, NV) and only two foreign Gigafactories (Grunheide, Germany and Shanghai, China), and we have to make some guesses, let’s say, since we don’t have any other way of knowing with certainty (because the Tesla Management team won’t disclose it…), let’s say that “Long Lived Assets” located in China are half of all “International Long Lived Assets” just for fun.
Because the actual numbers are apparently a closely guarded Chinese state secret, even though the Tesla Accounting Team has issued hundreds of pages of meaningless drivel in these filings, they apparently couldn’t find the space or justification to give us the book value of the China Assets or a clear concise China P&L. After all, why would an investor want to know anything about of a significant foreign operation, in a politically belligerent and hostile environment, apparently financed in whole (or at least in a significant part) by Chinese Banks and the Chinese Communist Government? The table below is a modified representation, including my “guesses” as to what a few P&L and Balance Sheet Ratios/Metrics for Tesla’s China Operations might look like:
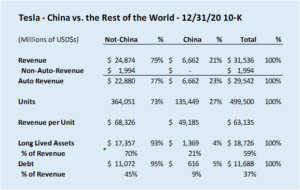
The questions and thoughts that come to mind when we examine the ratios are:
- Revenue per unit in China is roughly $20,000 per car less than the rest of the world. $68,326 vs. $49,185.
- It takes a much lower level of investment to produce revenue in China than the rest of the world. China Revenue has increased rapidly to 23% of total Auto Revenue or $6.662 Billion
- Moreover, the level of “Long Lived Assets” as a percent of Revenue in China is substantially less than the rest of the world (21% vs. 70%). Oddly, only 4% or Tesla’s “Long Lived Assets” are deployed in China and/or required to produce 21% of Tesla’s total Revenue.
- Presumably, since a much lower level of “Long Lived Assets” is needed to produce this level of Revenue, Tesla management was also able to accomplish this growth with a much lower level of debt. Note that debt on the books is only $616 million or roughly 5% of all Tesla debt. Remarkable. When we compare these figures with our observations, something else seems to be woefully amiss…how could the Shanghai Gigafactory possibly have a “Long Lived Asset” value that low? Is Tesla getting “free” off-the-books-capital from the Chinese government? Probably…
- So, in summary, what the above table tells us is that either: a.) Capital/Debt financing levels necessary to support a business of that size are much lower in China than in the rest of the world, and/or b.) The Chinese Communist Party is giving substantial subsidies to Tesla. and/or c.) Although the figures aren’t disclosed, we can presume that without what might be a very substantial Chinese cost reduction (slave labor, “free no strings attached” raw materials and infrastructure, etc.), that the non-China business is actually generating substantial losses (offset by the enormous Chinese Communist Party subsidies), and/or d.) The China Revenue/cost/capital/”Long-Lived-Asset” numbers are a “steaming pile of made-up total bull-$hit“….or e.) a frightening combination of all of the above.
- As an aside, the above gives us a new perspective on the meaning of the phrase “funding secured”.
Suggestion for PwC: Request that Management prepare an Income Statement by Region similar to the Pro-Forma format below…
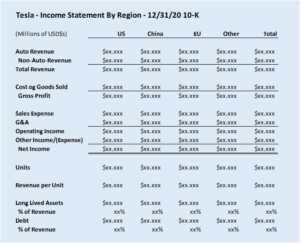
This relatively simple, one page financial statement, if correctly/accurately prepared, would tell investors significantly more about the business than the hundreds of pages of confusing circular gibberish that’s being produced, pumped and spewed in the filings now. On the other hand, perhaps there’s a very obvious/compelling reason as to why they aren’t publishing this information and likely never will. Again, sometimes it’s more important to understand the information that’s not disclosed in the filings than the information that is.
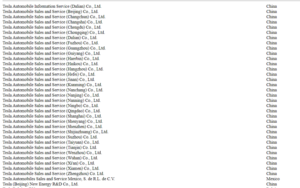
Exhibit 21.1 referenced on page 124 of the filing has some interesting information regarding 377 separate subsidiaries included/consolidated in the Tesla filing:
https://www.sec.gov/Archives/edgar/data/1318605/000156459021004599/tsla-ex211_15.htm
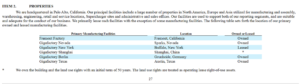
Feel free to peruse the names and locations of the individual subsidiaries included in the Tesla 10-K filing. I’ve listed a Summary of the Subsidiaries by location/domicile and jurisdiction below…..
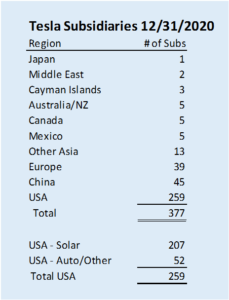
Bearing in mind that, in finance and accounting, there are always strategic reasons for every structural/domicile decision that’s made, but being an outsider we might wonder, from a legal/accounting and business perspective, why the 377 Subsidiaries exist and what their function might be? Here are some questions I might ask?
- I see that in relatively large markets like Japan, Canada, the Middle East, Mexico, Australia/New Zealand and “Other Asia (including India)”, where there are hundreds of millions of higher income consumers which would likely be target customers for Tesla products, we see that Tesla has less than a handful of subsidiaries in most of these markets? Why is that?
- I’ve noticed that you have three Caymans domiciled Subsidiaries, Dom Solar Lessor I, LP; Dom Solar Ltd.; and Firehorn Solar I, LLC. Grand Cayman is a really nice, sleepy, tiny little Caribbean island with a population of about 60,000 people. Do you consider the Caymans to be a key solar target market?… or are you just using these Shell Companies to launder Chinese Money?
- There are 45 Chinese Subsidiaries which presumably are required by the Chinese Government to retain control of RMB/Yuan at the local level and/or provide funding for kickbacks to local Chinese Communist Party prince-lings. It would be nice if, going forward, the 10-K included the amounts of these kickbacks by dealership/subsidiary/prince-ling.
- I noticed that of the 259 US Subsidiaries, that 207 of them seem to be related to the Solar Business, which has comparatively little revenue and a much smaller footprint than the Automotive business. Nearly all of these subsidiaries are domiciled in Delaware, which, as we are all aware, is a very popular construct/domicile for ShellCos with offshore interests. Are any of these businesses registered with (or related to Caymans entities) CIMA (Cayman Islands Monetary Authority) and/or do they exercise control over Caymans bank accounts? i.e.) Are these actually legitimate operating companies contributing to the bottom line or are they some sort of a cog in a massive offshore kickback scheme? Again, just curious.
Finally, I always enjoy reading the Auditors letter where, in this case, on page 51 of the filing, Price Waterhouse (PwC) certifies that (as always) there is absolutely nothing odd, wrong or suspicious about any of this, and even if there is, it’s not their fault or responsibility to catch it. My guess is that this will come back to haunt them at some point…..and in the depositions their audit staff will trot out the Auditors Opinion letter with a “see!…we told you so!”
Like I always ask, when investors rave about the capability of Regulators, Rating Agencies and Auditors……name one, just one, material, fraud/scam or mess that a Regulator or Auditor discovered and publicly disclosed…. BEFORE Mr. Market figured it out, tanked the stock and wiped out all of the dumb money…I’d like to hear about it…
..I’ll wait….
….still waiting..
….didn’t think so….
Now let’s move along to our good friends at Alibaba…
The Alibaba Investor Call…..and the Hits just Keep on Comin’
I took the time to listen to the latest Alibaba Investor call recording and, as always, they never fail to disappoint. Daniel Zhang’s voice is so calm, serene, soothing and confident that I plan on using the recording as a replacement for bedtime reading to my little nieces and nephews over the holidays. The recording is much more effective, at least to me, at relaxing and inducing sleep than the Cat in the Hat, Curious George or other books, nursery rhymes or fairy tales I’m familiar with…but perhaps that’s just me…
In any case, if you’d like to listen/read through this mess of buzzwords and jargon, in an effort to figure out why the incessant, diuretic stream of AACs, GMV, FMCGs, MAUs, FUs, non-GAAP adjustments and other buzzwords is relevant to the financial performance of this business, I’ve posted the links to the documents/filings/presentation and press release immediately below for your entertainment. Feel free to have at it:
Press Release: https://www.alibabagroup.com/en/news/press_pdf/p211118.pdf
Webcast: https://edge.media-server.com/mmc/p/qz7pqat3
6-K Filing: https://www.sec.gov/Archives/edgar/data/1577552/000110465921141204/tm2133400d1_ex99-1.htm
Presentation: https://www.alibabagroup.com/en/ir/presentations/pre211118.pdf
Perhaps I missed it, but for the first time ever they did not disclose MAU’s (Mobile Active Users). This metric has been one of their favorite, go-to, meaningless metrics since their first filing in 2014. (MAUs represents the number of people who regularly buy things on their mobile phone….Mobile Active Users) Here’s what they said in the June 6-K.
“In June 2021, our China retail marketplaces had 939 million mobile MAUs, representing a quarterly net increase of 14 million”
Perhaps they were getting nervous that in the September Quarter filing, at their current fake growth rates, this number now comes a little too close to exceeding the number of cell phones in China and someone who can do rudimentary math might spot it? Perhaps if they posted negative growth Mr. Market might ding their stock price? Who knows….in any case…it’s gone.
Along that theme, we can also take a look at the “Annual Active Consumers” (AACs), which are apparently defined as anyone who can spell “Alibaba”. Here’s what the 6-K says:
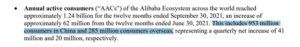 Apparently, the number of Annual Active Consumers is now the rough equivalent of the entire adult populations of China and the United States of America combined. Yeah….sure…that seems about right….
Moving along, for the second time they’ve touted the strategic importance of two hokey websites that suddenly appeared as a source of many of their brand new international “Annual Active Consumers”. These businesses first appeared as an afterthought in the June 2021 6-K and press release (https://www.trendyol.com/ and https://www.daraz.com/).
These strategic business/acquisitions weren’t mentioned in the March (year end) press release, but Trendyol , a goofy Turkish website (we all know how the Turkish economy has been on fire…literally…lately), was described as a new acquisition on schedule F-45 of the 20-F . Daraz, was mentioned twice within the hundreds of pages of 20-F drivel, again with no mention of basis, revenue, or income/contribution. Again, these two businesses somehow just suddenly appeared as extremely relevant, “highlighted” businesses in the current 6-K filings (2nd Bullet Point under “Business Highlights“) last quarter ….with no figures or business description whatsoever. This is likely intended as a misguided attempt to add credibility to the idea that Alibaba has somehow accumulated 265 million international (Annual Active Consumers) who spend most of their waking hours buying junk like crazy on two silly little websites, when in reality, in my humble opinion, it likely confirms that they don’t.
For the first time ever, again, out of the blue, in the current, barely a week old 6-K, they announced the development of a new computer chip and a database! (Yitian 710 Server Chip and the X-Dragon Architecture). Who knew?! They are truly flying under the radar, competing directly, head to head, with the likes of Samsung, Intel, Foxconn, et. al. by starting a microchip foundry on the side. These top secret projects and surprise announcements are reminiscent of the Shanghai Restaurant chain (whose name escapes me) that suddenly went public as a cloud computing company. Impressive, aggressive marketing, to say the least, but dim-sum dumpling rolling and microchip design are hardly interchangeable skill sets.
Questionable Assets and “Gains on Deemed Disposals”
Let’s take a step back now and look at one of my favorite Income Statement line items…”Gains on Deemed Disposals” For those of you who don’t know what this is, let me take a paragraph or two to explain.
If you are not familiar with this accounting scheme let me provide some background on the framework. IFRS (International Financial Reporting Standards) allow for the write up of financial asset values, essentially marking them to market if/when the same security is sold or transferred at a higher price.
Here’s the scam:
- Alibaba buys 1 million shares (50%) of a dog-shit business for $10 a share.
- A year later they buy the next 100,000 shares for $20/share. This allows them to book a “valuation gain” of $10 Million and their new basis in the stock becomes $12 Million for 60% of the company.
- A year later, Alibaba convinces a US Hedge fund to buy 10,000 shares of the dogshit company for $500/share. Alibaba loans the money ($5 million) to the hedge fund through a Caymans subsidiary so they can buy the dogshit stock. Alibaba likely provides some sort of scratch-my-back kickback or guarantee to get the deal done.
- Alibaba’s 1,100,000 shares of dogshit can now be valued at $550 Million ($500/share) and they can, under IFRS Rules, book another “Valuation Gain” of $538 Million.
- Keep in mind that the underlying stock is still “dogshit”. The economics and the business prospects of the dogshit company haven’t changed.
- These types of hypothetical transactions have been repeated annually, with great vigor, with many, many dogshit companies in every Alibaba 20-F since the company went public in 2014.
- The summary below describes the “Gains on deemed disposals” accumulated since the IPO.
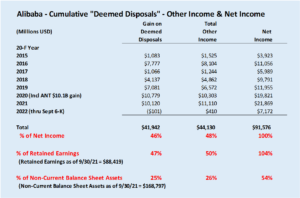
So what the above schedule shows us is that roughly half of Alibaba’s net income, nearly $42 Billion, is attributable to these “Deemed Disposal Gains”. Moreover, in order to generate these “gains” they have had to deploy capital in these other, (mostly Chinese) money losing, dogshit businesses where no objective market value has ever been established. Although we have no way of knowing, because financial statements (they likely don’t exist) on all of the newly acquired/consolidated/valued target businesses are not included in the filings, therefore, we can only conclude that these businesses are of, at best, questionable value. At a minimum we are probably looking at a $50 Billion write down at some point. When that happens (if ever), that’ll be one investor presentation/call that I wouldn’t want to miss.
How “Singles Day” somehow morphed into the “11 Day Global Shopping Festival”!
The following table illustrates how “Singles Day” GMV (Gross Merchandise Value) grew from $10 Billion in 2015, to $31 Billion in 2019 (the last year prior to the metamorphosis to the 11 day “Global Shopping Festival”) eventually growing to $84 Billion during the most recent 11/11/2021 global festival.
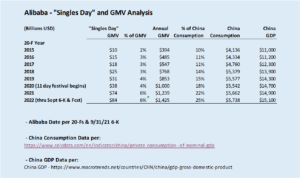
Interestingly, $84 Billion (the equivalent of 2 months of Walmart’s global sales) over 11 days ($7.6 Billion a day) would seem like a relative flop compared to 2019 (The last “Official Singles Day” where they recorded $31 Billion in just one day. Perhaps volume is falling off a cliff?….or perhaps there’s just something wrong with the fake figures?
I also think it’s remarkable that the Alibaba “ecosystem” GMV actually represents 25% of China’s Domestic Consumption now. You’d think that as they’ve grown from a non-factor 10 years ago, to having control over the disposition/distribution/billing and management of a quarter of China’s consumption, that there would have been an unprecedented wave of bankruptcies and realignment/upheaval within China’s retailers, department stores, grocery chains and domestic distributors as Alibaba has ruthlessly torched the competition. There should be vacant store fronts, thriving (or failing) distributors and last mile delivery people trying to figure out how to navigate the landscape and survive and/or prosper because of this onslaught and sea change. I’ve not seen anything like this taking place….have you? The Chinese retail landscape looks like business as usual to me.
Again, the obvious explanation here, once again, is that things are just not what they seem to be. I addressed this phenomenon back in a post I referred to as “The Blob” back in 2017. Simply put, what’s happening here is that Alibaba isn’t doing as much eCommerce as they claim. They generate the lions share of their GMV from “Craig’s List” types of listings which close outside of the platform. Whether these listings are Apartment Buildings, Yachts, Kazakhstan vacation homes, Jumbo Jets or non-performing loans, all of these transactions get lumped into (and grotesquely inflate) GMV. Alibaba management wants the world to believe that they are selling more than a Trillion US$ of socks, underwear, coats, toasters and consumer electronics in their “luxury pavilions” every year….when in reality…..it’s all a silly mirage.
Property & Equipment …and other “Questionable Assets”
Throughout the filings Alibaba management discloses Property and Equipment (net of depreciation). So lets take a look at what the actual Property & Equipment purchases look like over the last eighteen months (after we determine what these amounts are by backing out the depreciation).
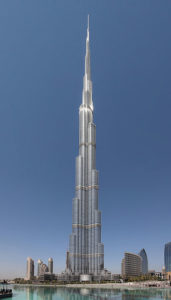 As you know, I like to measure Alibaba’s fixed asset acquisitions, or what they refer to as “Property & Equipment” in easily understandable terms that I can visualize. Since Alibaba is such a juggernaut, I needed to come up with something fitting, so I’ve chosen to measure their fixed asset acquisitions in terms of “Burj Khalifas“. The Burj Khalifa, as you probably know, is currently the tallest building in the world measuring 2,722 feet in height (a half mile+), built at a cost of $1.5 Billion in 2009. Isn’t she a beauty!
Alibaba’s Property and Equipment account increased by a remarkable $11.966 Billion (i.e. just short of 8 Burj Khalifas ) in the fiscal year ended 3/31/21. Even more remarkable, in the six months ending 9/30/21, when they had announced no material business acquisitions during the period, the Property and Equipment account increased by an additional $4.004 Billion (or 2.66 Burj Khalifas). Again, these amounts were capitalized with no description, reference, mention or hint (without wading through and reconciling the sparse/fragmented footnotes to the 20-F in its entirety) of what this $16 Billion (10.66 Burj Khalifas) in the last 18 months was spent on. Generally, when we see acquisitions like this, the usual scam is a variation of “capitalizing” items that have no future life (value) which really should have been “expensed”. The goal, of course, is to make the bottom line look a little better by reducing expenses. Here are a few examples/guesses of what might have happened:
- Salaries and wages were capitalized as DSCS (Dog-Shit Computer Software) rather than expensed, because the software might have some sort of “future value” at some point and could actually, perhaps (fingers crossed) work someday….or perhaps not.
- Money was spent on Communist Party Member vacation homes in the Maldives, Luxembourg, NYC, the Bay Area, Vancouver and Grand Cayman (accounted for as “warehouse space” on the books.). $16 Billion is the equivalent of 16,000, one million dollar vacation homes….no wonder real estate prices in these Western cities have been on a tear.
- Failing Evergrande properties were purchased at a discount….accounted for as “kitchen utensils” ….shrewd…
- Alibaba was helping out on the BRI project…buying a few African bridges, seaports and cobalt mines.
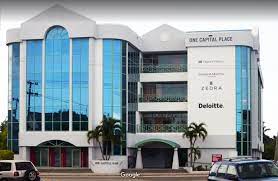
- I also heard that they remodeled their 4th Floor (Penthouse Space) at the Alibaba global HQ at One Capital Place, C/O Trident Trust Company (Cayman) Limited, PO Box 847 4th Floor, George Town, Cayman Islands, KY1-1103 . My understanding is that they put in some new cubicles, a fancy new phone system, updated the lunchroom and everyone got a new laptop….apparently no expense was spared. That’s just how they roll.
I have to say, I’m really hoping that PwC got verification of all of these Asset purchases (the equivalent of 10.66 Burj Khalifas in 18 months), inspected some of them and verified their existence. A diligent, skeptical, concerned audit team might have just fired up the old corporate jet and made a whirlwind tour of all of these assets before they accepted the full engagement fee (and gave an unqualified opinion on the financial statements)……otherwise there’s a good chance they are going to look pretty silly when the world finds out there’s actually nothing there.
“Questionable Assets”
Now let’s take a look at a longer time line. As you all know, Alibaba was founded in Jack Ma’s apartment on a wing and a prayer in 1999. The gang worked really hard and after just 15 short years they were able to accumulate US$9.408 Billion of what I’ll refer to as “Questionable Assets” book value defined in the table below. So they had been able, through hard work, perseverance and determination, to accumulate assets, on average, the equivalent of about a third of a Burj Khalifa a year for 15 years. This is, by any measure, an incredible achievement, especially considering the did it without the involvement of US Investment Banks (…with the exception of the last few years leading up to the IPO, when the underwriters of the US IPO, JPM, MS, Citi and the usual suspects had loaned them about US$8 Billion to help them get the books ready for the IPO, knowing full well they’d get paid back in spades once they sold it to dumb-ass US retail investors and pension funds).
Here’s the original filing:
https://www.sec.gov/Archives/edgar/data/1577552/000119312514347620/d709111d424b4.htm#toc709111_11
Now let’s compare where we were with Alibaba “Questionable Assets” before the friendly US Investment Bankers got involved, to where we are today ….
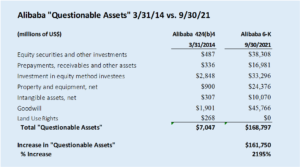
Whoaaa Nellie!….wouldja lookit dat!! It took them 15 years of hard work to get to $7 Billion and in just seven (7) short years, with the eager help of US Investment Bankers, Sullivan & Cromwell and Jay Clayton, et al, they’ve accumulated another $161.790 Billion of these “Questionable Assets”…
To help you visualize this incredible success story, picture that they’ve accumulated the equivalent of an additional 108 Burj Khalifas during those seven years….I’ll repeat that.
Alibaba has accumulated the equivalent of an additional 108 Burj Khalifas, in questionable asset value, during the last seven years. Visualize a sprawling metropolis…roughly 5 square miles of city blocks, the entire skyline comprised of half-mile tall buildings, where every building is a Burj Khalifa, all erected in the last seven years. That’s what the current valuation of Alibaba’s “Questionable Assets” would look like today if it was a construction project. I have to admit, it’s a strange visualization for a supposedly “asset light” business model.
Again, I really, really hope that PwC has verified and validated the existence and valuations of this incredible growth story, since, writing down/off a significant portion of these assets, that likely don’t exist, would put quite a dent in their business plan.
Speaking of Pricewaterhouse Coopers (PwC) they are either doing much less work or they’ve become really efficient at verifying assets scattered in what must be thousands of consolidated entities all over the planet now (Alibaba had stopped publishing the exact number of consolidated entities a few years ago at roughly 1,500) and replaced the disclosure with Exhibit 8.1 providing a few hundred names of the major subsidiaries while describing that the number, names and domicile of the smaller, global/foreign money laundering subsidiaries scattered all over the planet is irrelevant (according to them) ….I’m not kidding….read the footnote.
Anyway, here’s the bill for last years PwC work….roughly $20 million to sign off on this flaming dumpster fire. Alibaba’s been growing (so they say) at a 30%+ per year clip, thousands of consolidated entities domiciled in tax havens all over the world with presumed limited/no cooperation from Chinese authorities and Alibaba Management regarding record and facility access….all while adding the equivalent of “108 Burj Khalifas” to the Balance Sheet over the years ….and PwC cuts their fees by 18% YOY?….really?….not that much to do I guess…why generate billable hours when you’re going to just sign off on whatever absurd work-papers they put in front of you anyway…….really?…..
Now….What do Tesla and Alibaba have in common?
The obvious answer is voluminous, incomplete, nonsensical filings where figures don’t match other disclosures within the documents, or those of other Alibaba/Tesla affiliated entities (The ANT Group, for example, where the absurd draft-filing IPO was pulled because of its lack of believe-ability. Don’t worry, the revised mess is in editing and nearly ready to launch. You’ll get your chance to buy it soon enough.). In most cases, this “I can eat 50 eggs” level of outrageous misrepresentation, while Tesla and Alibaba, et al compensated groupies cheer them on and non-believers lament the inability to verify and/or disprove any of this nonsense, will continue unabated, until, of course, it can’t. The groupies and paid promoters/pumpers all fail to understand that since the bulk of the preposterous claims come from within the bowels of the Chinese Communist Party, far from the reach of Pricewaterhouse. (as PwC described in their annual “hey, we have no ability to verify any of this silliness and if it’s all bull-shit it’s not our fault …you are just a flaming dumb-ass for investing in this mess” Auditors Opinion-F5.)
One need only look at the track record of Chinese Stocks on US Exchanges and or, if you are unable to track these frauds, just take a peak at The China Hustle to see an obvious pattern. The aggregate market cap of all Chinese Stocks listed on US Exchanges has dropped from roughly 450 listings at $2.3 Trillion in 2018 (with several hundred Chinese stocks/ADRs/ADSs already “going dark” by then) to about half that many today.
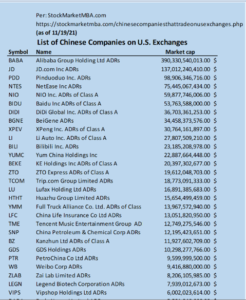
There are currently 253 Chinese Stocks/ADRs/ADSs listed on US Exchanges with hundreds of them de-listed or “going dark” over the years. The market cap of these remaining stocks was $1.348,616,842,191 ($1.348 Trillion) as of 11/19/21. The “Top 1o” by market cap represent $945 Billion or 70% of the total.
H/T to StockMarketMBA.com for providing this data…
When you really think about it, if Alibaba is the flagship and most sophisticated Chinese business/mess trading on US Exchanges today, and when you dig into it, it’s just a silly mish-mash of made up, unverifiable numbers, what in the world do the financial/business prospects and veracity of the other 252 listed businesses look like? I’m guessing the answer is “not very good” at a minimum.
CCP Controlled/Influenced Businesses….
The purpose of this section is to provide a framework describing the entity mechanisms deployed by the Chinese Communist Party to both collect and deploy Forex. Since the Chinese Communist Party has a tightly controlled, closed currency this system/network is a critical/essential cog in the machinery. Simply put, there is no meaningful RMB reserve outside of Mainland China, therefore, the Chinese use/need Western Currency to do business with the rest of the world. Their nearly unquenchable thirst for Western Forex, funded by a consistent trade surplus, began 25 years ago and, despite the saber-rattling trade war rhetoric, continues to accelerate today.
Sources of CCP Capital/Forex:
1.) Chinese Stocks and ADRs/ADS listed on US Exchanges (Alibaba, and the other 253 stocks as well as dollar bonds and debt denominated in Dollars/Euros/Yen/etc. et. al) Along with the continually burgeoning trade balance, these securities are a significant source of inbound Forex for the CCP.
2.) Foreign (Primarily US Dollar and Euro anchored) Businesses that depend (in varying degree) on Chinese influence, guidance, capital and supply chains. Examples of these businesses are Tesla, Amazon, Walmart, Apple, Home Depot, Lowes, Target, Bloomberg, Nike, etc. etc. These businesses are the primary source of China’s trade surplus and Forex flow.
3.) Crypto related businesses, although relatively new to the landscape, are a rapidly growing source of Forex for the CCP. They mine it and sell it. Easy peasy. Total global crypto/coin market cap has exploded to roughly $2.2 Trillion today (12/15/21) up from what was effectively a rounding error in terms of monetary policy just a few short years ago. Much of this Market Cap has inured to the benefit of Chinese miners and ergo, by extension, to the Chinese Communist Party.
Uses of CCP Capital/Forex:
1.) Foreign Investors and helpers (primarily US, Luxembourg, Caymans, Netherlands, Irish, UK, HK and other Tax haven based) that depend on Chinese money/funding and “advice” (again, in varying degrees) to generate out-sized returns.. We might include the GSIB Banks, Citadel, Bridgewater, Blackrock, Blackstone, Warburg-Pincus, ARK, Temasek, Carlyle, Sequoia, Sovereign Wealth Funds, etc., etc. to name a very few, as well as the teams of lawyers and public accounting firms who set up these offshore relationships and accounts. These are the businesses that deploy the Chinese Forex/capital accumulated through trade surplus and securities offerings (1, 2 & 3 “Sources” above) for the benefit of the CCP. Note that the asset appreciation and investment income thrown off by these efforts has surpassed the trade surplus by a wide margin over the last few years. Of course, I have no evidence that anyone on this “naming names” list above is doing anything illegal or improper….they are just lending a helping hand to Chinese investors. But, on the other hand, as a law enforcement friend of mine puts it, when you see a guy running out of a bank with a burlap sack, waving a gun while the alarms are going off, it might be prudent to ask a few questions.
2.) Meme stocks. (AMC, GME, TSLA, Peloton, Blackberry, SPACs, BABA, Crypto, etc. etc.) These are the targets that the players, money runners and “helpers” listed above pile into and out of to disrupt and destabilize markets while earning out-sized gains. The list can turn on the whim of the CCP. Simply put, if you know where the top and bottom is on any particular security, because you have the resources to establish both, you can make a nice return on the cycles.
“Other Financial Intermediaries” (OFIs)
Now lets take a look at where we are today on a macro level. The chart(s) below illustrate the meteoric growth of Financial Assets, particularly “OFI” (Other Financial Intermediaries) as defined by the Financial Stability Board (FSB). Here’s the definition; in simple terms these entities are private, largely unregulated, investment entities and funds, etc.
The data below is derived form the 2020 (Calendar year ending 2019) and 2016 (Calendar year ending 2015) Financial Stability Board Global Monitoring Report on Non-Bank Financial Intermediation
Links below:
2020 Report: https://www.fsb.org/wp-content/uploads/P161220.pdf
2016 Report: https://www.fsb.org/wp-content/uploads/global-shadow-banking-monitoring-report-2016.pdf
All Reports: https://www.fsb.org/search/?q=Global+Shadow+Banking+Monitoring+Report+&start=0
Here’s where we were in 2015:
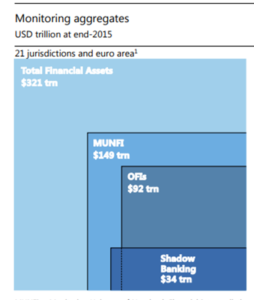
The Chart represents all global financial assets by reporting entity class. As we can see, OFI Financial Assets at $92 Trillion represent 28% of all Financial Assets on the planet (at least those reported by the participating jurisdictions)
Fast forward to 2019 (the most current report/study available….the FSB is roughly 2 years behind on their publications) and we can get an idea of what the growth in OFI Financial Assets looks like during the 4 year period (2015-2019).
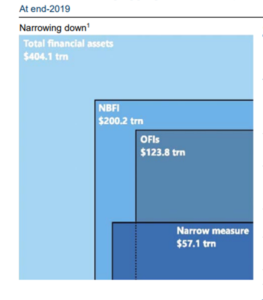
As we can see, OFI Assets (Private Funds and Hedge Funds, etc.) increased to $123.8 Trillion, a 34% increase in the 4 year period, now comprise about 30% of total Financial Assets.
Now, let’s take a look at the domicile of these Assets. As you might suspect, the lions share, about 80% of these assets are located in (generally) three places. 1.) Tax Haven Financial Centers (Luxembourg, the Caymans, the United Kingdom, Ireland and the Netherlands) 40%, 2.) the United States 30% and 3.) China 10%.
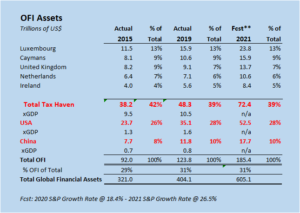
Also note that if we extrapolate at current growth rates, using the S&P 500 growth/return rate as an indicator, OFI Assets increase by $60 Trillion (50%) in the two year period from 2019 through 2021, when compared to a 30% increase in the four year period from 2015 through 2019. Note that the forecast increase in this example does not include additional capital contributions and new entity creation, which has been substantial. The forecast includes growth/appreciation only. It’s clear that the growth of OFI assets as well as all Tax Haven domiciled assets is accelerating at a remarkable pace.
A Few Comments on the Above:
1.) The Tax Haven Assets described above, in aggregate, are 10.5x the GDP of the underlying jurisdictions. As a point of reference 2021 Cayman Islands OFI Assets are roughly 2,650x Cayman Islands GDP of $6 Billion today. This Tax Haven money is coming primarily from US, Chinese, European and Japanese Investors. Unfortunately, because of the anonymous construct of these jurisdictions it’s impossible to tell where the money originally came from and how much of China’s, America’s, Japan’s and Europe’s capital is deployed in these jurisdictions. The only thing we know, with absolute certainty, is that it’s substantial and growing rapidly.
2.) I find it difficult to believe that China operates an economy of it’s size on a relatively small level of OFI Assets. Domestic Chinese OFI Assets are reported at $11.8 Trillion or roughly 80% of GDP in 2019, compared to 160% of GDP for the United States. My skepticism of Chinese data stems from a post I published in January of 2019 describing how the PBOC suddenly :”found” another US$50.1 Trillion in “shadow” Financial Assets….totally normal. Yet, they are reporting, per the FSB definition of OFI Assets, a fraction of this amount. The idea that the world’s 2nd biggest economy is functioning with a fraction (less than 10%) of it’s domestic Financial Assets in private hands, at best, lacks credibility and at worst, is a blatant misrepresentation.
The Cayman Islands a Tax Haven Case Study
I love the Caymans! It’s a beautiful, sleepy little island paradise. The home of 60,000 hard working islanders and domicile of roughly $15.9 Trillion (or about $265 million for every man, woman and child on the island) of non-resident, anonymous, absentee global wealth. These industrious folks have taken banking and asset management to a whole new level. All of these assets and entities that control them are regulated by the Cayman Islands Monetary Authority (CIMA). In order to accomplish this remarkable, carefully regulated growth, they’ve hired a few dozen of the best and brightest from all over the world. These nice folks are charged with the responsibility of producing really cool reports for nobody to read, as well as handing out sanctions and disciplinary actions, which, fortunately, are few and far between because they’ve done away with all of that pesky “know your customer” nonsense in order to keep the overhead down and the rubber-stamp machine humming along..
The quarterly reports (Fact Sheets) are all available on the link below dating all the way back to Q1 (March 31st) of 2015, when they apparently took a vote and concluded “Hey! we really should publish something about what’s going on down here so that when it all blows up we can say….’hey, we told you all about this mess….and you didn’t do anything about it….so hey not our problem!….so there!’ ”
FACT SHEETS – https://www.cima.ky/fact-sheet
Let’s take a minute to focus on three (3) Fact Sheets for a minute. For our amusement, we’ll analyze the 12/31/19. 12/31/20 and the most current 9/30/21 Fact Sheets. Here are the three graphics with a couple of interesting figures/areas circled in red.
I know these small graphics are difficult to read, so I thought I’d produce a quick schedule (below) highlighting the figures I feel are important. The other odd thing about this report IMHO even though the report is produced by the Cayman Islands “Monetary” Authority…..they don’t discuss “money” at all in the report. There are all sorts of metrics but nothing describing Assets Under Management/Custody/Control by domicile, asset class or type of entity. Nothing. In short, this is probably the dumbest, most abbreviated, useless and frightening government report I’ve ever seen….and that’s saying something. To their credit, they actually did produce an “Investments Statistical Digest” at one point, which they’ve either stopped issuing or they are just three years behind on the publishing schedule. Their last report was for the year end 12/31/2018….which is pretty much irrelevant now. I understand that they’ve been really, really busy rubber-stamping Chinese ShellCo and bank account registrations and coming up with CYA (Cover Your A$$) plans, laws and excuses for the lack of KYC (Know Your Customer) enforcement, and lack of record keeping, but really, what’s up with this? Do they not have computers? Do they work on island time? Three years to produce a report on asset values?…c’mon man….
To save you some time and hopefully add a little value (hey…it’s what I do) I’ve put together a tiny little schedule showing why these dumb “Fact Sheets” foretell the death of the US Financial System and the US Dollar as the world’s global reserve currency as we know it. Please bear with me….here’s the silly little schedule, produced from their silly great-big numbers:
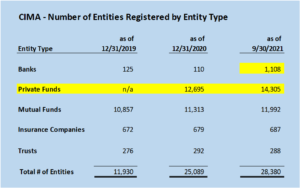
First, let’s look at the number of “Banks” registered in the Cayman Islands. We note that the number of registered Banks has increased from 110 to 1,108 in the last 9 months. This figure is, at best, curious, since, by comparison, there are only 4,300 FDIC Commercial banks licensed in the entire United States. The ratio of “banks per-capita” (1 bank for every 60 people) seems odd to say the least. Did they change the definition of “bank”? Did all sorts of entities suddenly decide that opening a bank in the Caymans would be a great idea? Is it a typo? If it’s a typo, IMHO it would be even more disconcerting since that would indicate that (as I had said) nobody, not even the people producing, proofing and reviewing these reports, actually check the figures…..which might also make me concerned that they are putting the same level of care and competence in the regulatory aspects of the process that the Chinese do with their SEC filings.
Oddly enough, the first report that provided the count of “private funds” was the June 30th, 2020 report. Apparently they chose not to publish a report for the March 31st, 2020 quarter, for whatever reason. No big deal, nobody looks at this stuff anyway….I mean, it’s only 28,380 entities running $15.9 Trillion in anonymous financial assets so why bother taking a look at anything. Those 12,695 private funds that just popped up out of nowhere are just a bunch of rich Chinese dudes….they take the staff out to dinner when they’re in town. Great guys and gals. Probably no need to put ’em on the report, but what the heck…nobody reads this stuff anyway….so let’s list ’em.
Finally, in just the last 9 months (1/1/21 through 9/30/21) another 1,605 private funds were created. If we hearken back to the Caymans 12/31/2019 FSB OFI Asset Figure of $10.9 Trillion and 1,000 new banks and 14,000 new Private Funds really were created, my estimate of $15.9 Trillion of OFI Assets in the Caymans might actually be way too low. The number could be closer to $20 Trillion…but what’s $4.1 Trillion among friends?
In the words of the immortal Vince Lombardi, possibly the greatest regulator in history…..
If you have any questions or concerns on the above gigantic numbers or odd ratios, feel free to connect with the CIMA Management team, who I fondly refer to as “The Angels of Death“. These folks are the best and brightest, that the Cayman Islands Monetary Authority has to offer, recruited from all over the world. They are renowned experts at “no questions asked rubber-stamp paper pushing” relentlessly focused on breaking down road-blocks which would otherwise limit the tidal wave of anonymous Shell Company money pouring into these accounts and eventually on to US Markets, Financial Assets, Bank Accounts, Hedge funds and other “helpers”.
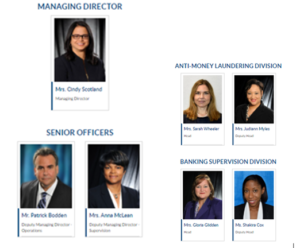
https://www.cima.ky/managementteam
Nice looking group of kids….I’m sure they are really nice people…just what you want from a regulator.
Yup….I don’t know why anyone would be concerned about $15 Trillion dollars, much of it Chinese (Alibaba, Tencent and their Subsidiaries are the parent companies of hundreds of these entities) flowing into 25,000+, private entities/funds (most newly created) and 1,100 newly created “banks” regulated by a handful of relentlessly-customer-service driven-folks who apparently never met an accountant, lawyer, client, deposit or ShellCo they didn’t like, while simultaneously ignoring the scope of what they are doing/creating. What could possibly go wrong?
The Scope of the Problem…
In an attempt to define how much of this global asset growth is attributable to the Chinese Communist Party, I’ll resurrect and update a schedule I had first published a few years ago. The simplest way I can explain what’s happening is to describe China’s net trade surplus as their “net income” and “savings”. Again, since the RMB is a closed currency and isn’t used outside of mainland China, we know with certainty China receives Forex (Dollars, Euros, Yen, etc.) for payment in exchange for goods and services. Since they’ve run a trade surplus for roughly 30 years, they also pay their bills using a portion of the Forex they’ve received. The “surplus” Forex must remain in Dollars, Euros, Yen, etc. and invested in assets denominated in that particular Western currency. Of course, since the Western currencies float, they can easily be exchanged for other currencies, and invested in assets in that particular currency. Easy peasy?
I had published this chart years ago describing how Forex wealth “Boomerangs” from American Business on through to the Chinese Communist Party, to be redeployed to US Financial Assets and Markets.
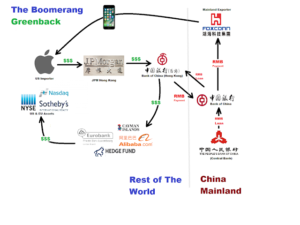
The above describes the flow of US Dollars when Apple (AAPL) purchases an iPhone shipment from Foxconn, but there are limitless permutations of this transaction depending on products sold and assets purchased. You can substitute Amazon, Walmart, Nike, Target, Macy’s, Lowes, Home Depot and/or countless US distributors/importers dependent on the CCP Supply chain as the importer/payer. You can substitute any large/International US/European/Japanese and/or Chinese bank as the dollar flow facilitator, The key to the “boomerang” is that the dollars stay in the Western financial system, controlled by CCP interests in CCP Accounts (rather than accounts controlled by Western interests) while funding to the Chinese vendors is paid, by the Chinese Banks in RMB. The big picture result is the same. China Inc’s stealth war chest of Western (floating currency) Assets continues to grow by leaps and bounds.
So now let’s take a look at the numbers….
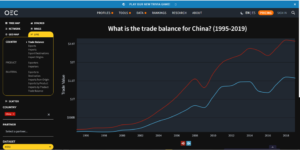
All figures below are per the Observatory of Economic Complexity (OEC). For those of you who are unfamiliar, the OEC was initially an MIT project dedicated to the visualization of International Trade Relationships and the analysis of the complexity of same. We can “drill down”by country, component, region, etc. in order to visualize the what’s happening. Here’s the link, it’s a wonderful tool.
https://oec.world/en/visualize/line/hs92/show/chn/all/all/1995.2019/
The chart below illustrates the annual difference between Exports (Red line) and Imports (Blue line) for the Chinese Economy since 1990. Once we examine the data, as expected, we see that the Chinese Economy has run a significant, growing to massive, trade surplus for more than 25 years.
The table below shows the data from the above chart for the period 1995 thru 2021. We assume that, for the purpose of this table, China’s annual Trade Surplus is reinvested in un-leveraged Western Assets (stocks, bonds, real estate, etc.) using the annual S&P 500 return to approximate the compounding effect of this accumulation. This assumption, of course, could be overstated or understated, depending on the actual success of the CCP Investment strategy. The far right column shows what the value of this cumulative trade balance/surplus might be, at year end, if prudently invested in Western Assets. Again, we know with certainty that this accumulated surplus, $52.06 Trillion illustrated here, MUST be controlled/owned and managed by Chinese investment vehicles/entities and individuals primarily in the Tax Havens and consequently, passed through to Western markets/economies i.e.) USA, Europe, Japan, etc., but remaining under the constructive control of the Chinese Communist Party via the “helpers”. There is no other place this funding can be since the RMB/Yuan is a closed currency. There is only a token amount of RMB available to Western financial institutions, current estimates are less than $100 Billion of RMB/Yuan exist off-shore world wide…..a mere pittance.
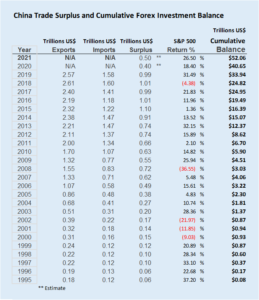
The above estimated $52.06 Trillion (Invested Trade Surplus) does not include Forex capital raised in Western Equity and debt markets, nor does it include funds borrowed/leveraged in Western Currency using these controlled Western Financial Assets as collateral, therefore the hidden/anonymous balance could be significantly larger.
Again, for emphasis, this anonymous control of these assets and the resulting wealth transfer MUST exist somewhere in the Western Financial System. It must exist, again, since there is no significant Yuan/RMB balance outside of mainland China. The CCP has effectively accomplished the financial control that everyone thought the Japanese had aspired to (and feared) in the 1980’s. Remember when Japanese developers bought Pebble Beach Golf Course and everyone went nuts? Naysayers of this thesis often opine that “The Japanese tried the same thing and failed…China will fail and enter an economic malaise as well…there’s no difference”. My off hand, “this time it’s different” response is always three fold.
1.) The Japanese, at the time, could not keep the Yen walled off. With limitations, if an investor wanted to buy Yen and invest in Japanese stocks/assets, or trade in Yen they could. The Yen was a floating, though managed, currency which reflected the economic value and purchasing power of the underlying Japanese economy at the time. Conversely, the RMB/Yuan/CNH is strictly controlled today and walled off from the rest of the world. As an experiment, if you are a US Investor/Banker, have excess capital, and are not a “helper” or CCP affiliated investor, try to buy 10 Million RMB at spot and let me know how you do. I’d be curious.
2.) The offshore financial system, as I’ve described above, is much more anonymous, robust and available than it was 40 years ago. Tax Havens and transfer mechanisms didn’t exist to anything near this degree in the 1980’s. There was no place to hide. Asset balances, transfers and deposits back then were subject to Western Bank regulation and inspection. The result is that we’ve gone from no meaningful offshore/anonymous asset balances ten years ago to $72.4 Trillion of OFI (Private/Hedge Fund, etc,) Assets in the five major Tax Haven jurisdictions (Luxembourg, the Caymans, Ireland, the United Kingdom and the Netherlands) the equivalent of roughly 140% of all US domiciled OFI Assets today.
3.) The asset balances have become so large, with the ease and fluidity of fund movement now so instantaneous; and the opacity/anonymity has become so acceptable, that traditional Central Bank Monetary Policy and tools will be rendered useless, if they’ve not been already.
Final Thoughts….
This cumulative $52.06 Trillion illustration of Anonymous Western Currency Denominated Offshore Assets (AWCDOA) controlled by the Chinese Communist Party has likely found its way, at least to some degree into every nook and cranny of the Western Financial System. Massive flows of Western Forex generated from China Inc’s, sale of phones, shoes, chemicals, computers, clothing, appliances, pharmaceuticals, telecom equipment, etc. etc. flow in and are redeployed through layered accounts and Shell Companies in Hong Kong, the Caymans, Ireland, Luxembourg, the Netherlands, etc. etc. and further invested in financial assets and Real Estate in America, Europe, Canada, Japan, Australia, etc. etc. financial centers. There is no question that this has happened. The endgame, of course is that the CCP will continue to wreak havoc on Western Governments and financial systems, causing never ending stimulus, money printing and destruction of the West’s basic economic engine. The question is….what are we going to do about it.
I suppose our leadership can continue along this Nefille-Chamberlain-esque path, listening to the thousands of CCP affiliated think-tankers, self proclaimed “experts”, social media trolls, sponsored politicians and highly compensated “helpers” and capital deployers and conclude that there is nothing to see here. We can continue to believe that we will forever be the leaders of the free world and our financial markets will forever remain second to none …they just need a few tweaks. Yup…nothing to see here….
We can conclude that everything we’re seeing, with our own eyes, is just a haphazard confluence of random, unconnected events and teeny-tiny coincidences. We can continue to believe that there is absolutely no interconnectedness and no “root cause” for these seemingly unrelated global-financial and geopolitical events and happenstance.
We can just keep accepting that bargain basement, slave labor pricing of the Chinese supply chain, subsidized, discounted delivery, shipping and postal costs, resulting in an ever increasing Chinese Trade Surplus is good for America. We can assume that the rise of the Amazon, Walmart, et al. on-line retail environment, sucking the life out of small town America and destroying US Commercial Real Estate values is progress.
We can assume that all of these crazy, rogue/criminal IP theft, espionage, money laundering cases, which somehow involve some level of Chinese government involvement and politically motivated sanctioning and hostage taking is standard operating procedure. We can believe that Meng Wanzhou and the Huawei hostage diplomacy saga was just another, one-off, isolated incident, just like the type of misunderstanding and spat that goes on between Canada, France and Australia on a nearly daily basis. i.e.) Rugby players accused of spying are exchanged for containers of Champagne and foie gras every day…it just doesn’t make the papers or the evening news.
We can ignore the coincidental Hong Kong political disruption, the Taiwan “fly overs”, the curious island building and expansion of heavily armed “fishing fleets” in the South China Sea, the support of the North Korean government as they continue to test-fire rockets toward mainland Japan, and of course, the “oopsy daisy”, accidental virus discovery, with ground zero being within spitting (or coughing) distance of the world-renowned Wuhan Institute of Virology, that spread around the world with no notice or acknowledgement of anything going off the rails by the Chinese Communist Party. It’s become so absurd that American Comedians are joking about it….and US Retailers are actually advertising on the Youtube clips because it gets page views….you just can’t make this stuff up…
We can continue to tell ourselves that the hundreds (253 remaining) of ridiculous Chinese Stocks/Bonds/ADRs/ADSs etc. sponsored by our American Investment Bankers/Underwriters and “helpers” on Western Exchanges are a legitimate “opening up” of the Chinese economy and not just an absurdly veiled, multi-Trillion dollar, fraudulent, decade long dollar grab (when you include the pump and dump potential and collateral potential) and that the activity surrounding meme-stocks is just normal market forces at work and there’s nothing insidious about Chinese influenced market makers taking control of any particular stock price, testing the relationship between the options markets and impact on passive flow, refining their “pump and dump” methodology as they go.
We can tell ourselves that the gigantic build-up of tens of trillions of dollars (soon to be approaching a hundred trillion) of anonymous Western Currency denominated offshore financial assets is just tax cheats, drug dealers and uncoordinated rogue capital flight from Zimbabwe, Russian Oligarchs and the occasional exiled Venezuelan Oil Barron just trying to manage his money in absentia’.
The CCP believes, and based on the West’s posturing, rightly so, that the most expeditious, least costly way to win a war is if your adversary doesn’t understand that they are actually in one. The end game of all of these total war beach-heads described and taking place as defined above is the greatest fraudulent, illicit wealth transfer in history, the precursor of the eventual destruction of Western Financial Markets and will, if left unchecked, usher in the death knell of the Dollar as the worlds Reserve Currency and the rise of the Chinese Communist Party as the only remaining unchecked Super Power on the planet (Please read that last sentence again, a few times if necessary, in context, think about it….and let me know where I went wrong….I’ll wait.)
In short, we can continue to believe our influencers. We can continue to place our faith in the army of controlled politicians, central bankers and lobbyists who refuse to take any action whatsoever to stop or even slow this gravy train down. We can rely on the integrity of our bankers, lawyers and accountants who are making a fortune on this scam to eventually come to their senses, listen to their consciences and take action to save us poor working stiffs in the West from our own self induced (so we are told) pathetic naivety induced destruction….maybe the influencers, media, politicians, investors, bankers, and “helpers” are right. Maybe I don’t know what I’m talking about. Maybe I shouldn’t believe my own eyes? Maybe they aren’t all in cahoots? Maybe I’ve got it all wrong and I’m misinterpreting everything that I see, hear and smell that comes out of the Chinese Communist Party? Maybe these things are all coincidences, perhaps little coincidences….or perhaps “big coincidences” but coincidences nonetheless.
Hey….stop laughing….it all might be a big coincidence…
Oh…and by the way…I almost forgot….
MERRY CHRISTMAS…HAPPY HOLIDAYS & HAPPY 2022!! 🎅